Lu and Romps, Is a wet-bulb temperature of 35 degrees Celsius the correct threshold for human survivability?, ERL, 2023
Errata
There should be no ρ in equations (1-4). This has been corrected in the PDF below.
Paper
Description
In studies of global-warming impacts, it is common to use a wet-bulb temperature of 35 °C as a threshold for human survivability. The idea is that a human's wetted skin is much like a wet-bulb thermometer and, if it gets to 35 °C, then it is too hot for the body to move metabolic heat from the core to the skin fast enough to maintain a survivable body temperature. But the wet-bulb thermometer is not a particularly good model for a human: it omits metabolic heat, radiation, and respiratory ventilation.
A better model for human thermoregulation is the heat index, which is based on a physical model that incorporates these effects. The heat index has two critical values: a value at which hyperthermia begins and a value that is fatal if sustained. We show that a wet-bulb temperature of 35 °C is between these two critical values. For example, in a world warmer than preindustrial by 10 °C, about 30% of the world's population would be exposed once or more per year to a wet-bulb temperature above 35 °C, but the heat index reveals that less than 2% would be exposed to fatal conditions. On the other hand, over 60% would be exposed to conditions that would cause hyperthermia.
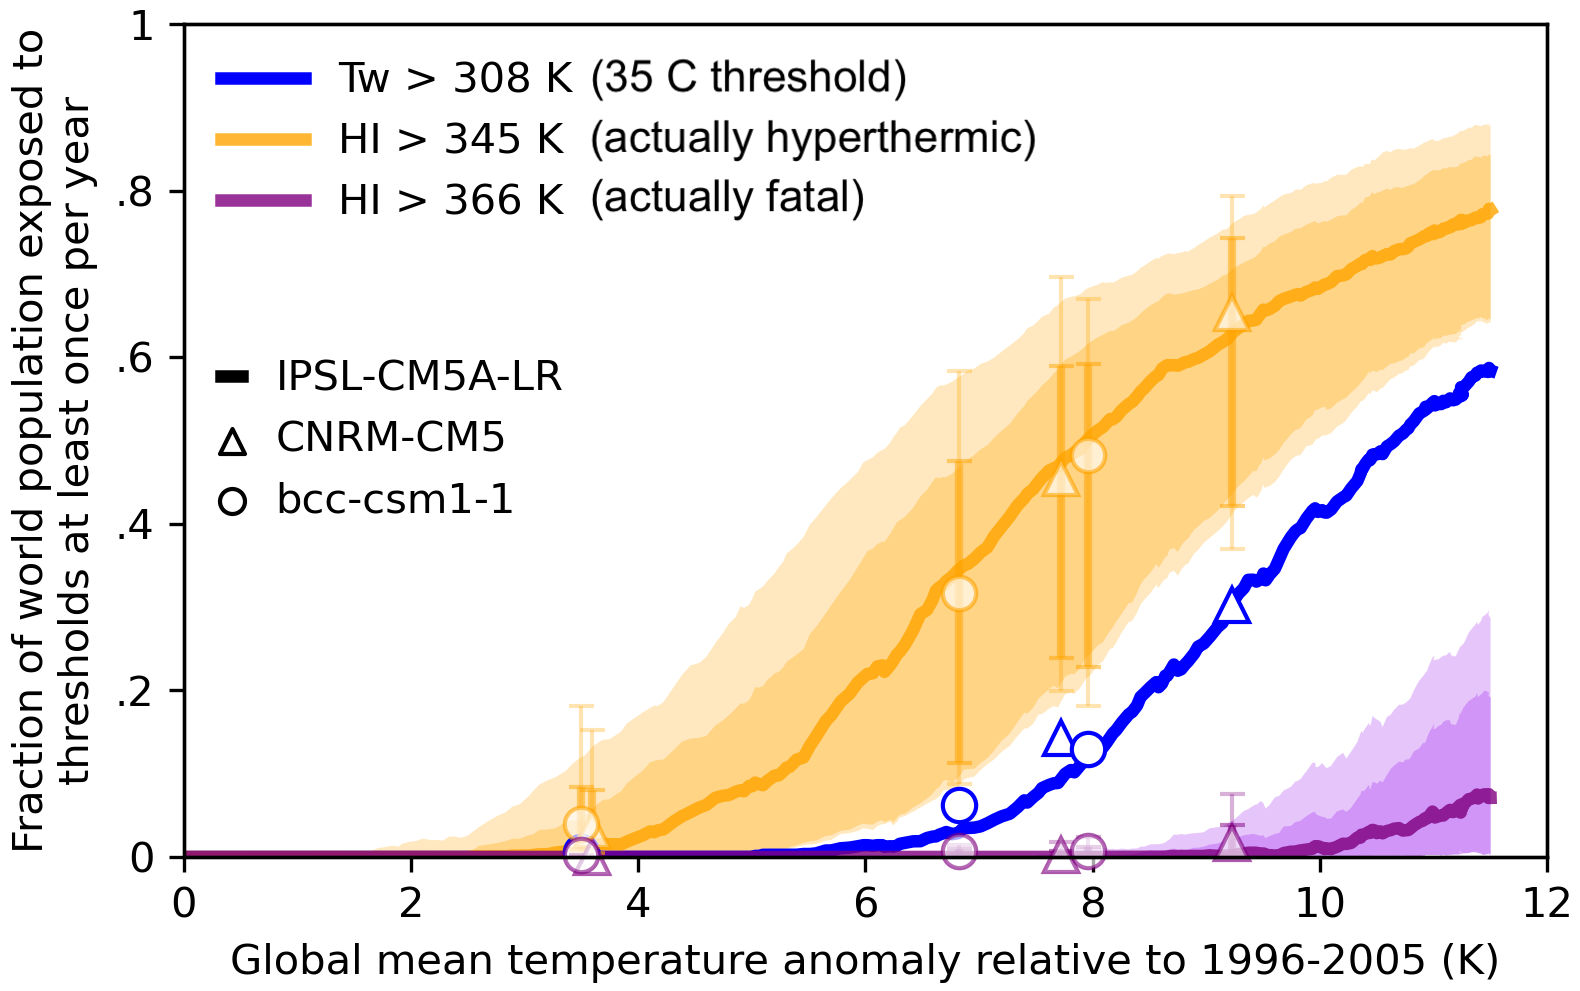
The fraction of the 2005 world population experiencing three criteria: wet-bulb temperatures greater than 308 K (blue), heat index greater than 345 K (hyperthermic; orange), and heat index greater than 366 K (fatal; purple) as functions of the global-mean temperature anomaly relative to 1996-2005. The curves plot these fractions for the IPSL-CM5A-LR simulation of RCP8.5 scenario from 2006-2300, inclusive. A ten-year-window averaging is applied to each year smooth the curves. The symbols have the same meaning as the curves, but are calculated using the CNRM-CM5 (round) and the bcc-csm1-1 (triangle) simulations, averaged over the last ten years of the 21st, 22nd and 23rd centuries. The light shadings and the thin error bars are the spreads due to a range of metabolic rates of 50-300 W/m2, and the dark shadings and thick error bars are the spreads due to a range of windspeed of 1-4 m/s.